Four basic reports are included in your Paid Memberships Pro “Memberships” admin area. These reports highlight Sales and Revenue, Signups and Cancellations, Active Members by Level, as well as data for Member Visits, Views and Logins.
Reports Overview
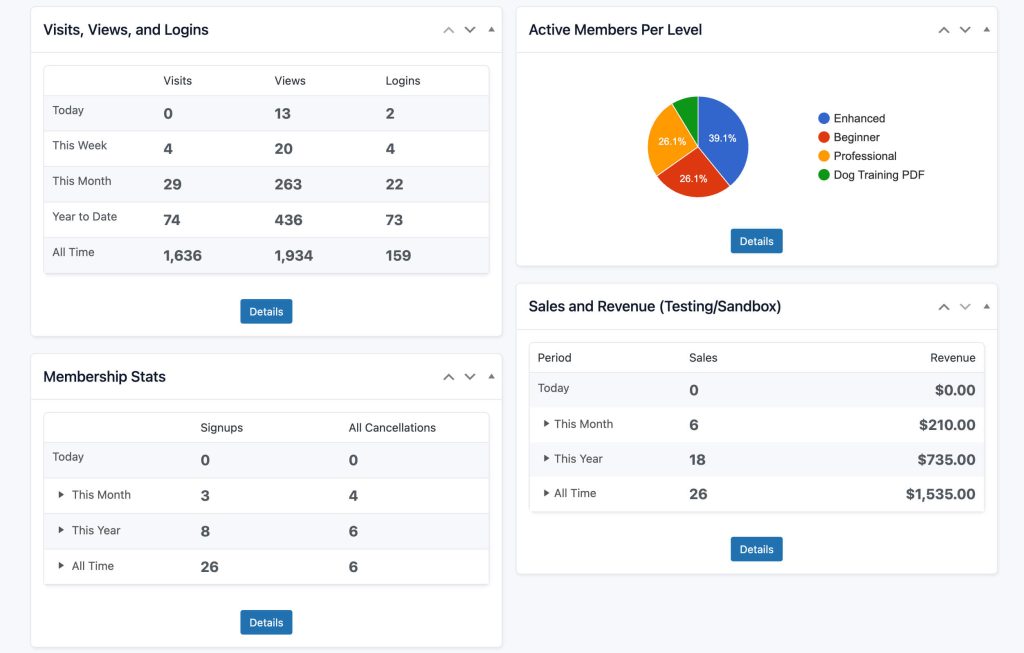
Navigate to Memberships > Reports to see a snapshot of the primary reports, including Sales and Revenue, Visits, Views and Logins, Active Members Per Level, and Membership Stats for Signups and Cancellations. Any Add Ons that include a report will also display on this dashboard page.
Report data reflects the entire history of membership activity on your site since activating Paid Memberships Pro. You can reset report data by using the Developer’s Toolkit Add On.
Sales and Revenue Report
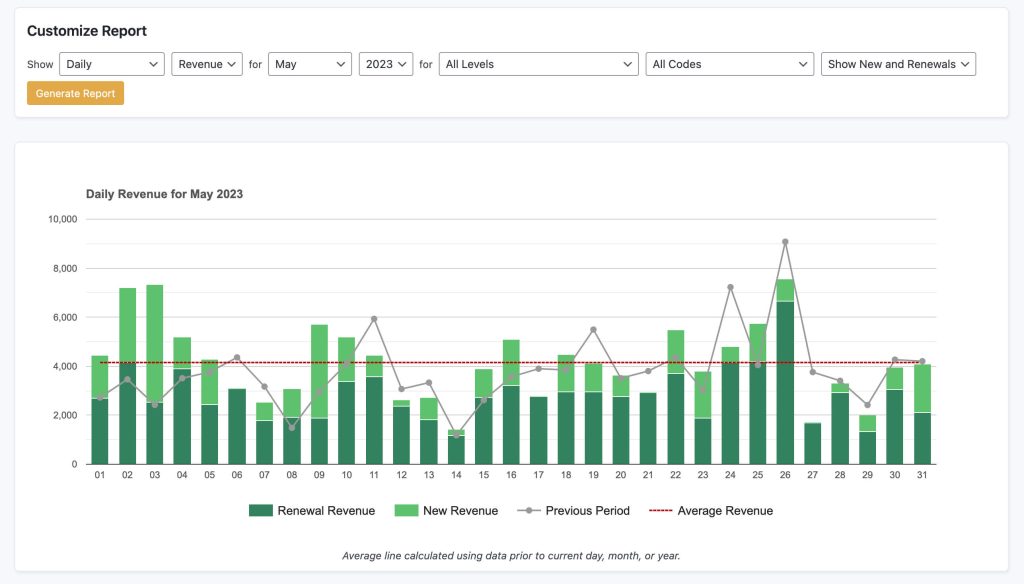
The Sales and Revenue report gives you valuable insights into the sales volume and revenue generated by your membership business. With this report, you can analyze your data across different time periods and filter the information based on specific criteria.
Here are a few noteworthy features:
- View data based on membership level ID and discount codes used for checkouts
- Interactive charts that separate new and recurring sales or revenue
- Charts include an average line and previous period comparison to provide a benchmark for the report’s data
Sales and Revenue Report Features
- Filter by Time Period: The Sales and Revenue report offers flexible filtering options to view data according to your preferred time intervals. You can choose to filter the report by the following time periods:
- Annually (All Time): This option displays the cumulative sales volume and revenue for all-time data.
- Monthly (Chosen Year): Selecting this option allows you to specify a particular year, and the report will show the sales volume and revenue for each month within that chosen year.
- Daily (Chosen Month): By choosing this option, you can select a specific month, and the report will present the sales volume and revenue for each day within that chosen month.
- Last 7 Days: This filter shows the sales volume and revenue for the most recent 7-day period, providing an up-to-date snapshot of your business performance.
- Last 30 Days: Similar to the previous option, this filter displays the sales volume and revenue for the previous 30 days, enabling you to track trends over a slightly longer period.
- Last 12 Months Running: Selecting this filter allows you to view the sales volume and revenue for the past 12 months, providing a comprehensive overview of your business’s recent performance.
- Custom Range: This filter allows you to select a custom date range, providing flexibility to analyze sales and revenue for any specific period that meets your needs.
- Compare to Previous Period: The Sales and Revenue report also allows you to compare the data with the previous period, which helps you to assess your business’s growth or decline. This comparison feature provides valuable insights into changes in sales volume and revenue, helping you make informed decisions.
- Filter by Membership Level ID: You can further refine the report by filtering the data based on a specific membership level ID. This filter allows you to analyze sales and revenue specific to a particular membership level, providing insights into the performance of different tiers or groups within your customer base.
- Filter by Discount Code: Additionally, you have the option to filter the report based on discount codes used at the checkout. This filter enables you to assess the impact of specific discount codes on your sales and revenue, allowing you to evaluate the effectiveness of different marketing campaigns or promotional strategies.
View Sales and Revenue Data
Within the Sales and Revenue report, you have the option to view different types of sales and revenue data:
- New and Recurring Sales or Revenue: This view displays both new sales or revenue and recurring sales or revenue, allowing you to understand the contribution of both these categories to your overall sales and revenue figures. The interactive charts in the report separate the data for new and recurring sales or revenue in the bar charts, giving you a clear visual representation.
- Only New Sales or Revenue: By selecting this option, the report will focus solely on new sales or revenue, enabling you to analyze the performance of recently acquired customers or clients.
- Only Recurring Sales or Revenue: Choosing this option will show only recurring sales or revenue, giving you insights into the impact that existing customers or clients have on your business.
Charts and Data Table
The Sales and Revenue report includes interactive charts that visually represent the data for easy analysis. When viewing the combined data for new and recurring sales or revenue in the bar charts, the chart will separate the two categories, allowing you to compare their contributions.
The chart will also display an average line, which represents the average sales.
In addition to the charts, a table is now available to display the chart data, providing a detailed numerical view for further analysis.
Visits, Views and Logins
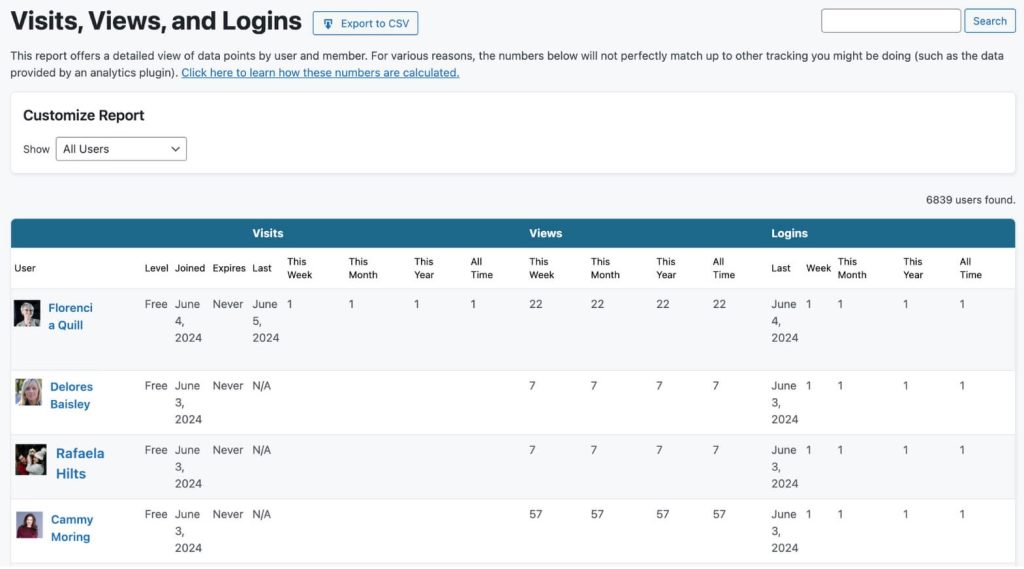
This report shows aggregate user statistics for the day, month, and all time. The full report offers a detailed view of data points by user and member.
For help understanding this report, we define each as the following:
- Visits: Tracked once per browser session.
- Views: Counted once per page load.
- Logins: This counts each single “login”.
About Report Discrepancies Between Traditional Analytics Tools and PMPro’s Report Data
If you are using another analytics tool, for example Google Analytics or Matomo, we want to note that your analytics platform data and Paid Memberships Pro’s report data will never be a 100% match.
- PMPro tracks logged-in users, whereas tools like GA can track general visitors (non-users).
- Third-party analytics tools are impacted by visitors who use incognito browsing, ad blockers, and other privacy settings.
- PMPro tracking is impacted by users who block cookies.
Here’s an example of why your Google Analytics 4 data would be different from your PMPro “Visits, Views, and Logins” data.
- GA4 tries to identify a “session”, which is a group of user interactions with your website that takes place within a given time frame. Even when that single visitor leaves your site and returns in the same day, GA4 may still track this as a single user’s “session”. GA4 eliminated the concept of “page visits” as we saw them in the past.
- PMPro’s tracking just increments once every page load, regardless of if the user visited the same page 1,000 times or 1,000 different pages once.
Neither reporting system will be 100% accurate, but that does not mean either reporting tools is 100% inaccurate. The real stats for your site are somewhere between both of these reports.
Active Members Per Level Report
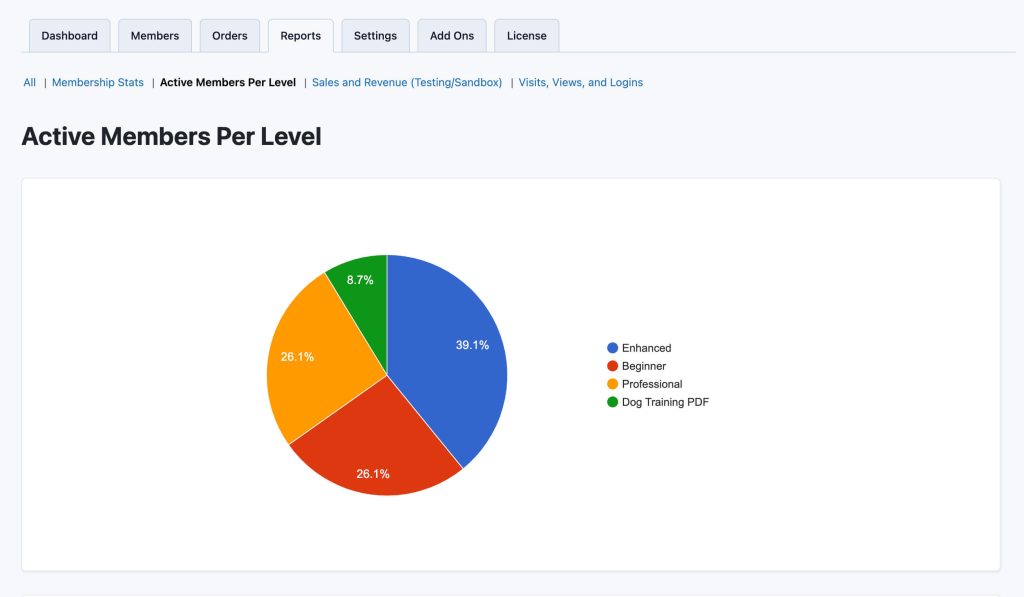
The Active Members Per Level report in Paid Memberships Pro gives you a comprehensive overview of the distribution of active members across different membership levels within the system. This report offers valuable insights to administrators and managers regarding the popularity and utilization of various membership levels.
Accessing the Report
To access the Active Members Per Level report, follow these steps:
- Log in to your website’s admin dashboard.
- Navigate to the Memberships menu on the sidebar.
- Click on Reports to access the Reports screen.
Report Layout
This report includes both a table and pie chart format for easy data interpretation.
Table View: The table view provides a detailed breakdown of the active members per membership level. The following information is included in the table:
- Membership Level: Lists the name or identifier of each membership level.
- Member Count: Displays the total count of active members associated with each level.
- The table allows you to quickly compare the member counts across different levels and identify trends or discrepancies.
Pie Chart View: The pie chart view shows the distribution of active members per membership level. Each membership level is represented as a slice of the pie, with the size of the slice proportional to the number of active members associated with that level.
The chart’s legend shows you the membership levels represented by each color.
This gives you a quick visual assessment of the relative popularity or utilization of different membership levels. It offers an intuitive and visually appealing way to understand the distribution of active members across the levels.
Membership Stats
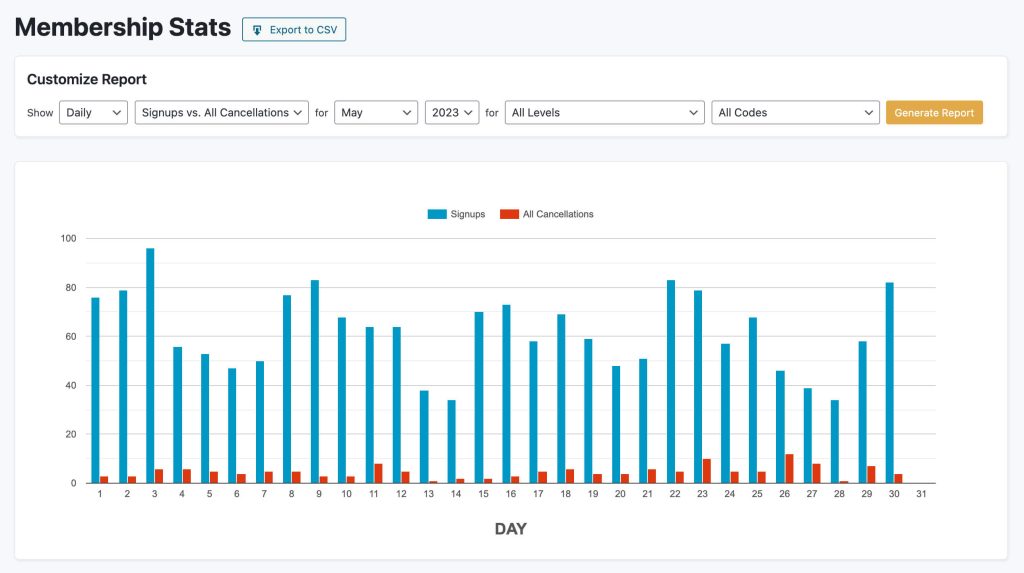
The report details various Membership-related stats including Signups and Cancellations (for all time, this year, this month, today).
The Membership Stats report widget provides an overview of your signups and cancellations that you can expand to see stats per-price point paid that period.
Click through to view the full report which shows filterable charts comparing Signups and Cancellations by time period and membership level.
How to Export Report Data
With Paid Memberships Pro, you can export nearly any piece of data tracked in your membership site. For example, you can export your full members list, your full orders list, or any filtered view of this data.
We also support exporting the data that is used to generate any built-in report.
- In the WordPress admin, navigate to Memberships > Reports.
- Select a single report to view details.
- In the report title, click the “Export to CSV” button. This will download a CSV file of the exact data used to generate that report.
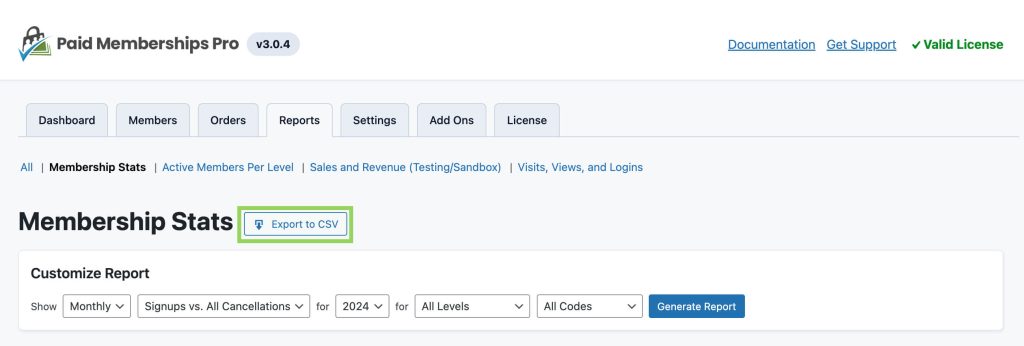
You can import this data to your preferred spreadsheet program or use a web-based application like Google Sheets to create additional views, comparisons, or graphs using this data.
Video Demo
Custom Reports
Additional custom reports can be developed for your unique needs. This article outlines how to add a new custom report to your membership site. Contact us to discuss your report needs and get developer guidance on how to build your report for this data.
Last updated on February 13, 2025

